
Thursday, October 29, 2026 was the peak of Q3 earnings season, and the two calendars that win this site's searches cannot agree on how big it was. Yahoo Finance's earnings calendar counted 291 reports that day, in a week that built from 67 on Monday to the Thursday peak. Nasdaq's earnings calendar, same day, same season, showed 323 reports. Neither is wrong. They are counting different things, and the 32-report gap is the most useful lesson the calendar pages teach.
What each calendar counts
A calendar entry is an editorial decision before it is a fact. Calendars differ on whether they list companies with confirmed dates only or estimated dates too, whether foreign-listed and OTC names are in the universe, and whether a company that reports before the open and one that reports after the close land on the same day in every timezone convention. Nasdaq's table, which shows time, symbol, EPS, surprise percentage, market cap, fiscal quarter and the consensus forecast in one row, casts the wider net. Yahoo's tighter count and its day-by-day week view make the season's shape easier to see. Investing.com's calendar splits the difference and adds the global layer: filters by country and sector, with the Apple print on November 2 carried at a $1.99 EPS forecast on $113.38 billion of expected revenue.
How to use a peak day
You cannot read 300 reports. You can read a calendar the way professionals do: by surprise, not by alphabet. Sort the day by the size of the consensus gap and the day compresses to a dozen names that actually moved. The rest is noise with a ticker symbol. Our own coverage on this site follows the same rule: the calendar post names the dates that matter, and the recaps take apart only the prints that changed a story.
The before picture
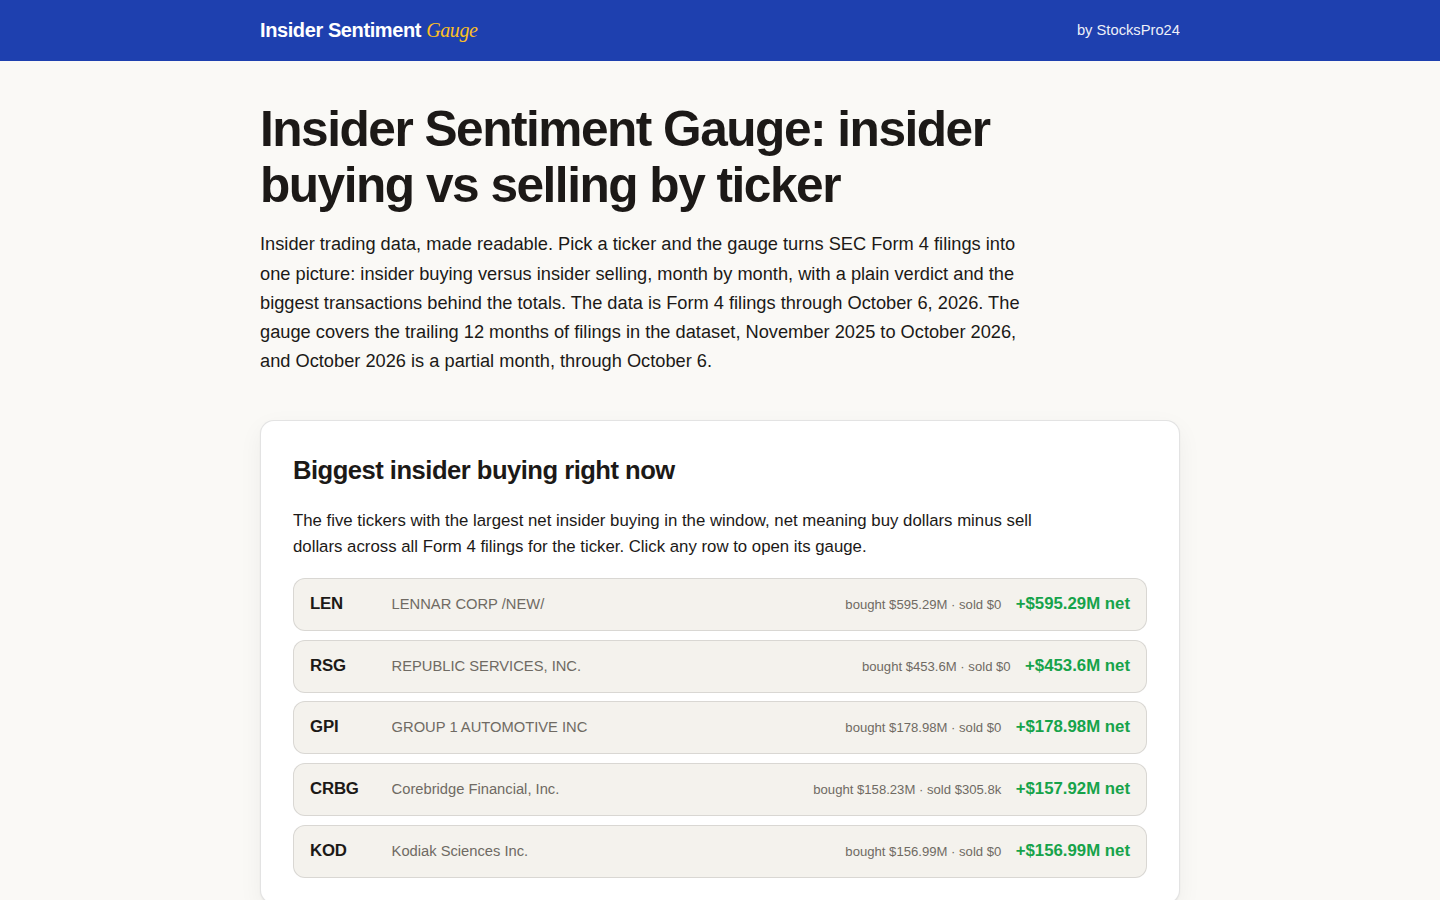
The calendar tells you when. It says nothing about what the people inside the companies did in the weeks before the print, which is the other half of earnings season. That is the half the Insider Sentiment Gauge covers, from 9,060 insider trades in our database: who bought, who sold, and whether the buying clustered. Read the calendar for the day, the gauge for the run-up, and the surprise column for the verdict.